Live debugging
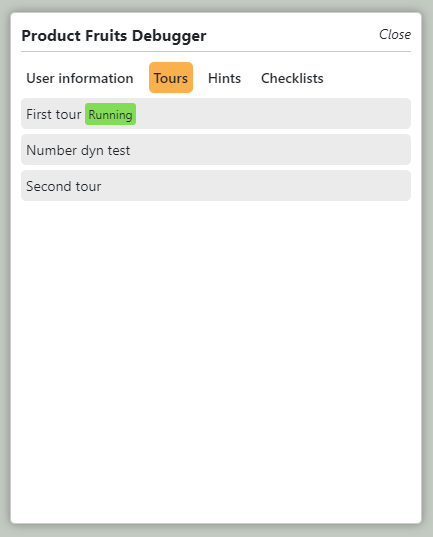
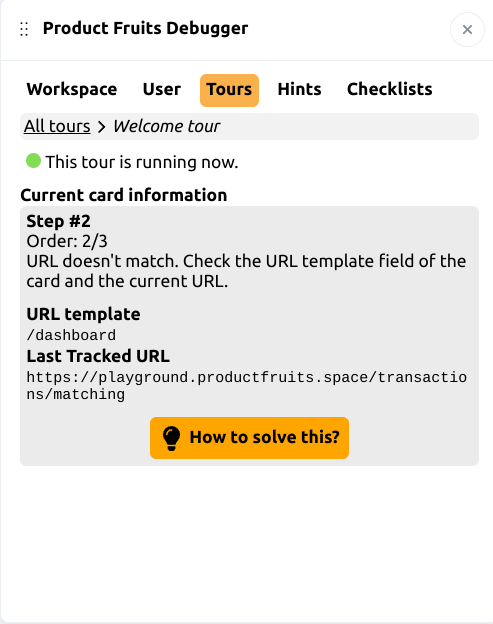
When you build and publish Product Fruits content, you might come across issues like hints not displaying, tours not starting, or checklists not being visible. We have a robust window tool that you can use on your live site. This tool will tell you the current state of your Product Fruits content.
The window can be used both inside and out of the Product Fruits extension.
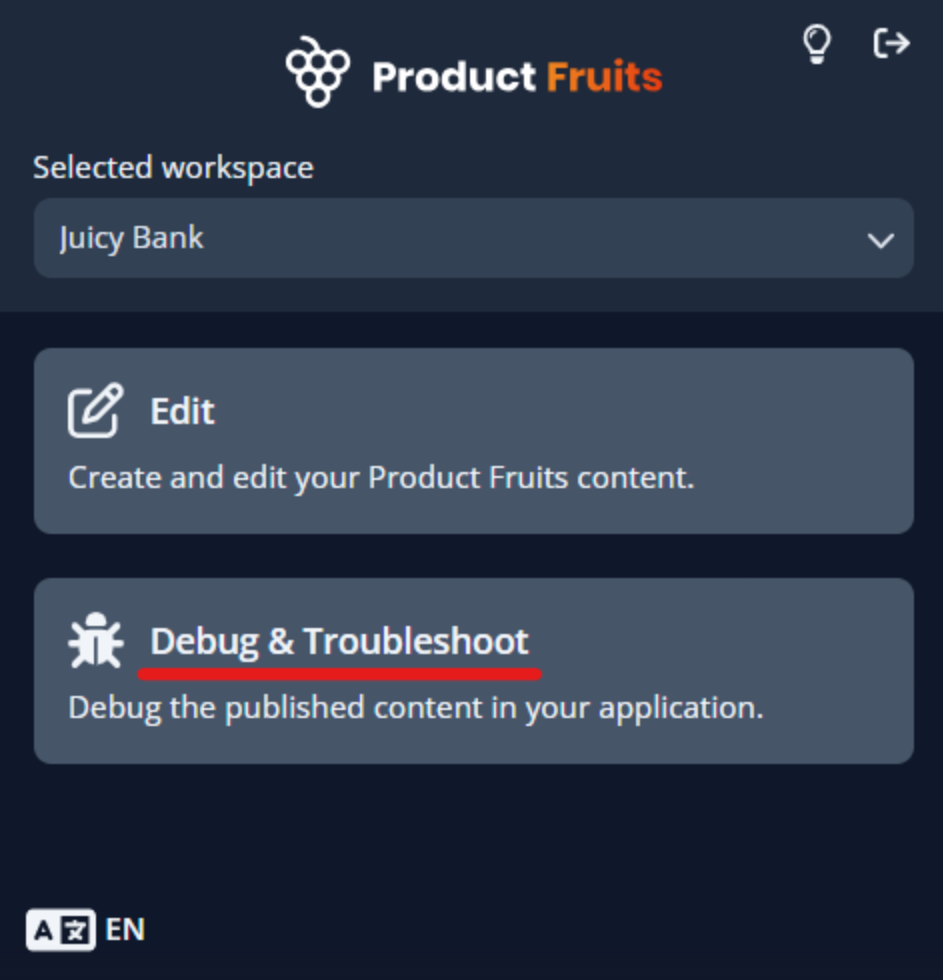
How to start the window from the extension icon
If there is an error in your Product Fruits workflow, the extension will show an option to Debug & Troubleshoot. Simply select this option and you should see the window open in the upper-left corner of your browser.
How to start the window outside the extension
A. Via Bookmark
If you are using bookmarks, you can drag & drop the link below into your bookmarks toolbar. The window can be then launched easily by clicking on the bookmark when your application is loaded in a particular tab.
Drag & drop the following link to the bookmarks toolbar: Launch Product Fruits window
B. Via Browser Console
If you want to use Browser Console to launch our window, you can. The following steps are valid for the Google Chrome browser.
Step by step
- Navigate to a page in your application that the Product Fruits code is installed in.
- Right-click somewhere on the page to display the system menu and click "Inspect".
Note - sometimes you may get a different menu when right-clicking e.g. on a YouTube video or similarly embedded instance on the page. Try right-clicking elsewhere in your application.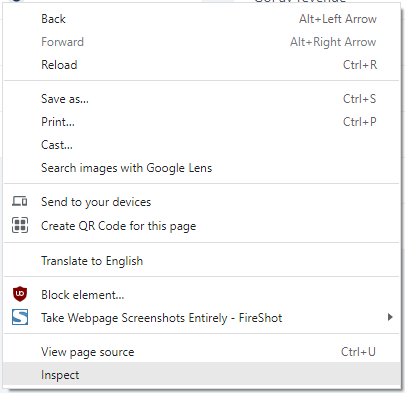
- A new panel or window similar to this will appear

- Copy and paste
window.productFruits.services.attachwindow()into the Console window: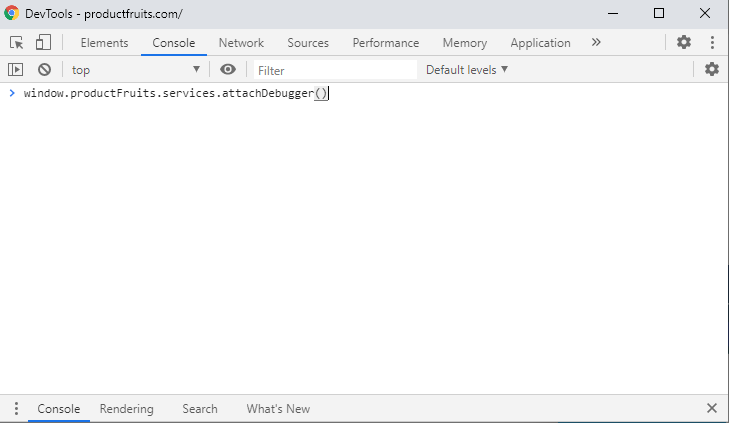

- Press
Enter. You can now close the Developers tools by clicking on the close button in the corner of the window or panel.
- The Product Fruits window should appear in your application: